Efficiency is being defined as the percentage of a dollar donated to Spark that ends up being granted to LCMSD. These figures are provided in Spark's federal tax filings, which can be viewed both at the IRS website and here at ProPublica. I had also provided the historical calculations derived from Spark's Form 990 filing figures as part of Spark's historical financials presented in the Letter 1 appendix that can be viewed here. The below is a great graphic that explains the calculation from cpajournal.com (they call what I have termed Efficiency as Program Service Expense Ratio).
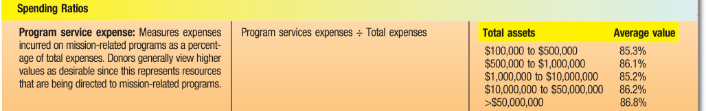
Unlike most nonprofits, local school district nonprofits typically are the only nonprofit raising money for that entity (not competing for that specific cause) and there is no research cost as the beneficiary is pre-determined. Thus, they can and should be very efficient. The money Spark and peers receive as donations: i) goes to the kids; or ii) is spent on salaries / other operational costs. When I first looked at Spark's financials, I was surprised at how little of the donations were actually going to the kids in recent years, but I also had no context. I didn't even know what a Form 990 was until earlier this year.
So instead of trying to form opinions without any domain expertise or context, I decided to simply benchmark Spark against its peers and see how it compared. The answer unfortunately is not well. The below analysis is from the June 1st letter to Dr. Geithman that attempted to call attention to the matter. Note that while the new financials have effectively the same Efficiency figures as the old financials, I have not updated the below figures for Spark's restated financials which did include some rebucketing of expenses.
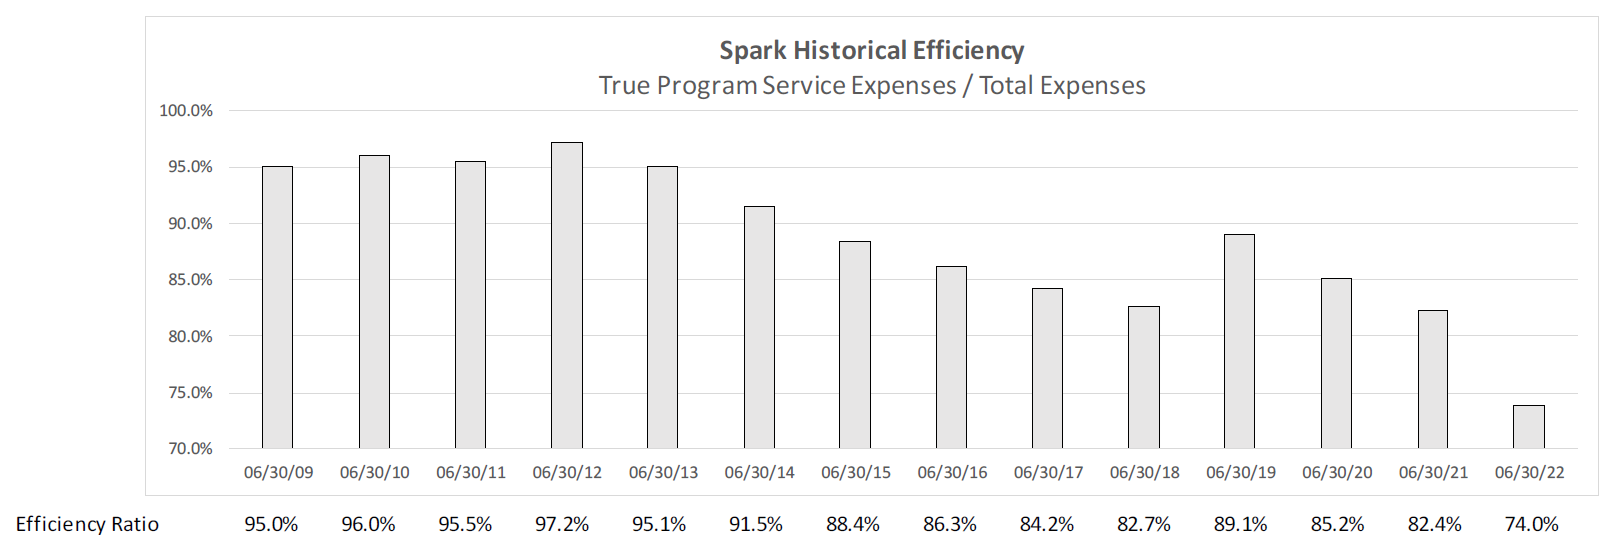
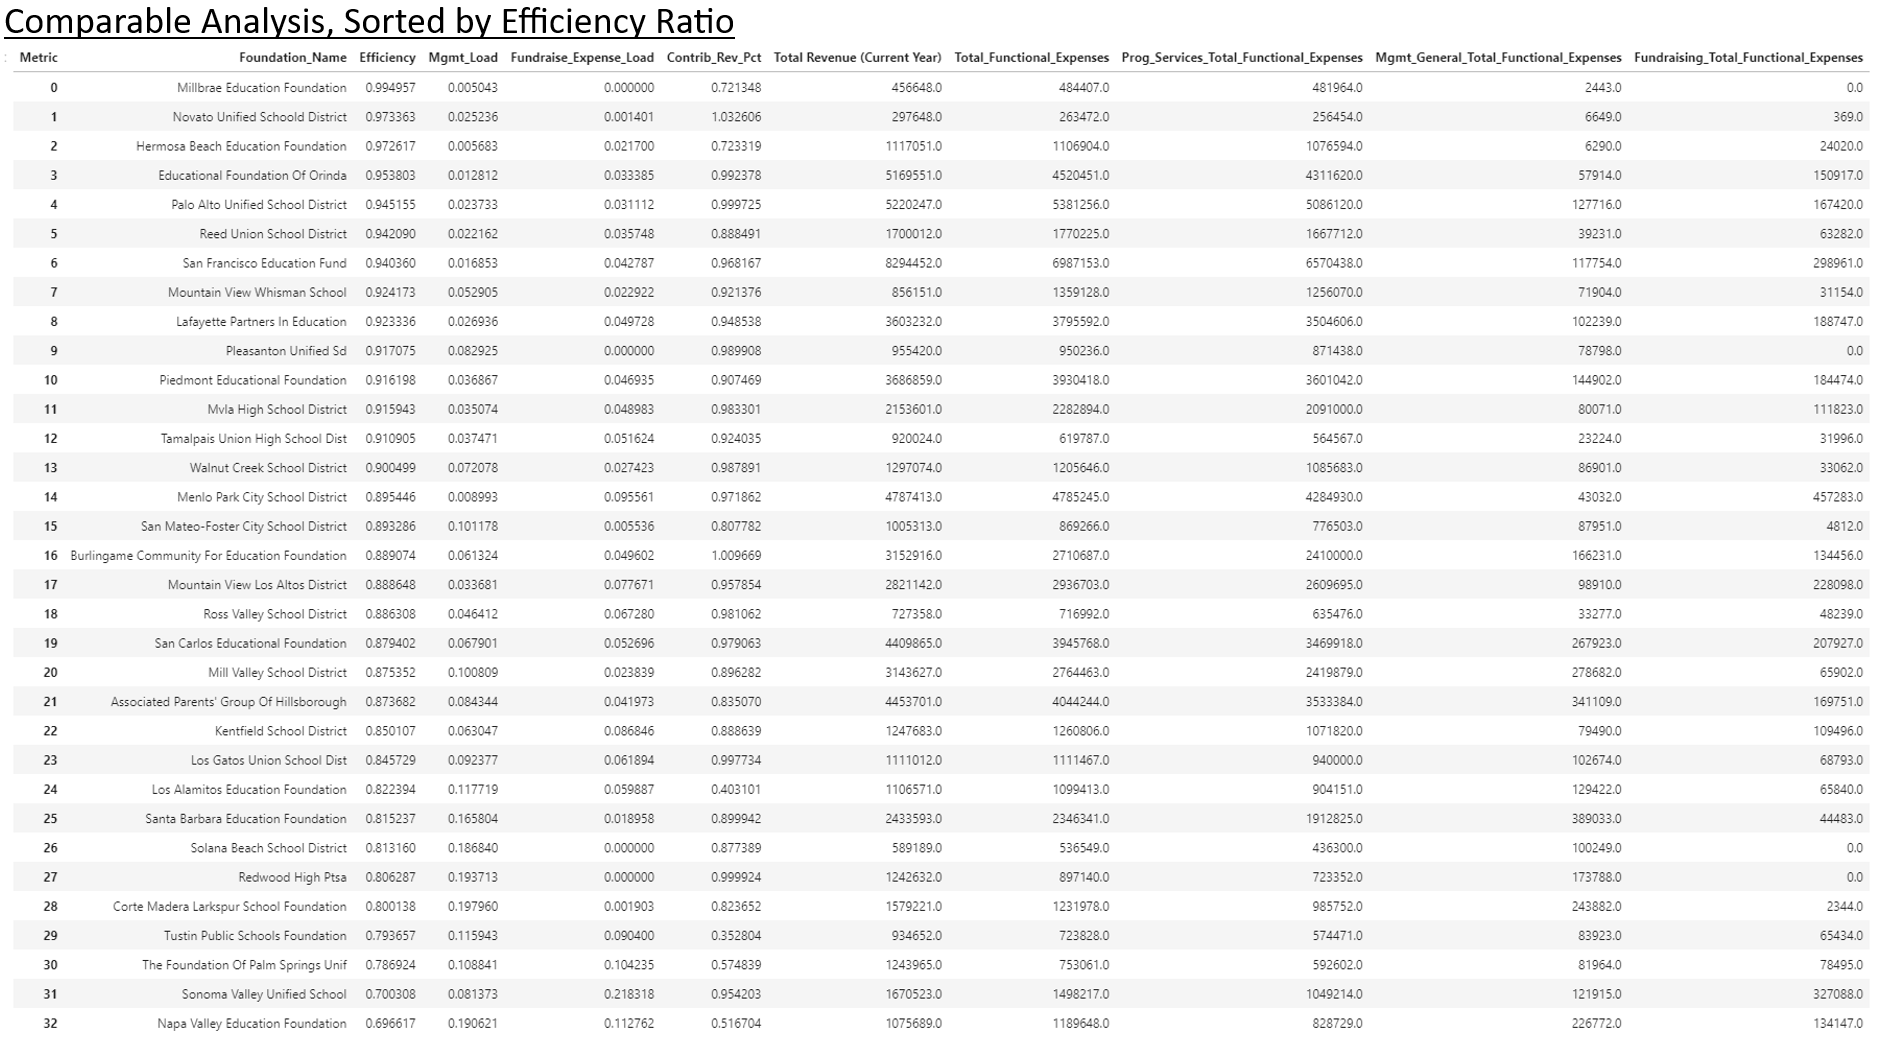
I pulled data on 32 comparable 501(c)3 entities that also raise funds solely for their local school district. The takeaway is that well-run organizations typically contribute ~95 cents of every dollar raised to the beneficiary school district. When well-run, these are largely passthrough entities. Furthermore, Spark historically operated at these same levels: from 6/30/2008 to 6/30/2013 Spark contributed 95.8 cents of every dollar donated on average as grants. Regrettably, this ratio has been on a sharp downward trend since Sara Ryba joined the organization and in the last fiscal year Efficiency again dropped precipitously once adjusted for misallocated expenses. Today, only 74 cents of every dollar donated to Spark makes its way to the district. The school district’s fundraising arm has gone from best-in-class to worst-in-class in Efficiency when benchmarked against comparable school district nonprofits in less than a decade.
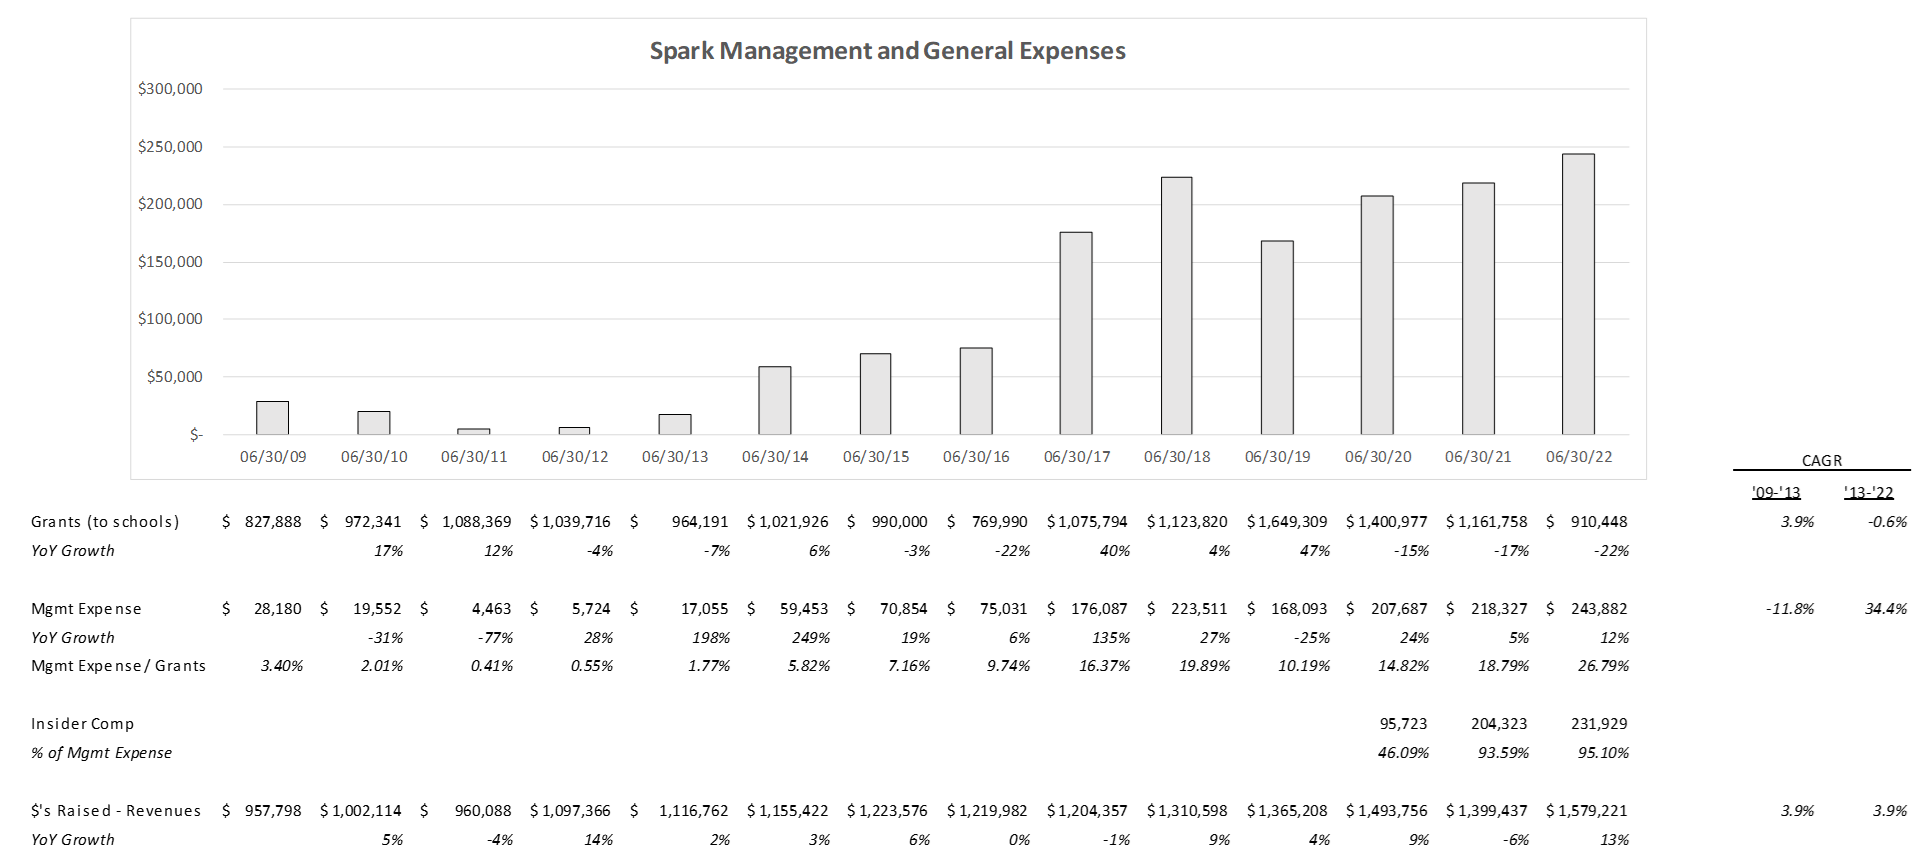
Below is a chart depicting Spark's Efficiency levels each year since 2009. The chart below shows that unfortunately we have seen a substantial increase in the percentage of each dollar Spark receives being spent on non-kids stuff. The vast majority of this non-kids spending has been tied to insider compensation. Since Ms. Ryba joined the foundation in 2014, the amount of money per each $1 in donations that goes to the kids has plummeted from 95 cents to 74 cents.
This is not a more broadly occurring phenomenon that is being similarly suffered by other school district charities. Other well-run nonprofits continue to operate with mid to high 90’s Efficiency, like Spark used to. This is true for both organizations bigger and smaller than Spark on a revenue basis.
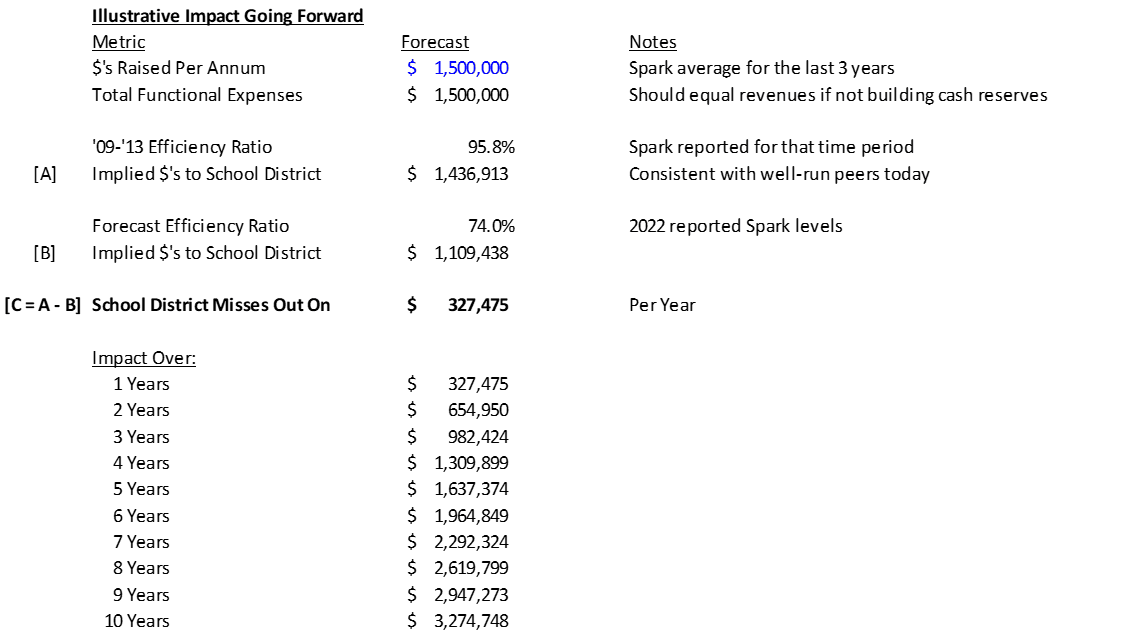
The cost of this is real: below is an outline of the additional funds that would have gone to schools if Spark Efficiency had remained at these prior levels since Sara Ryba joined Spark (6/30/13 to 6/30/22) and in the latest fiscal year.
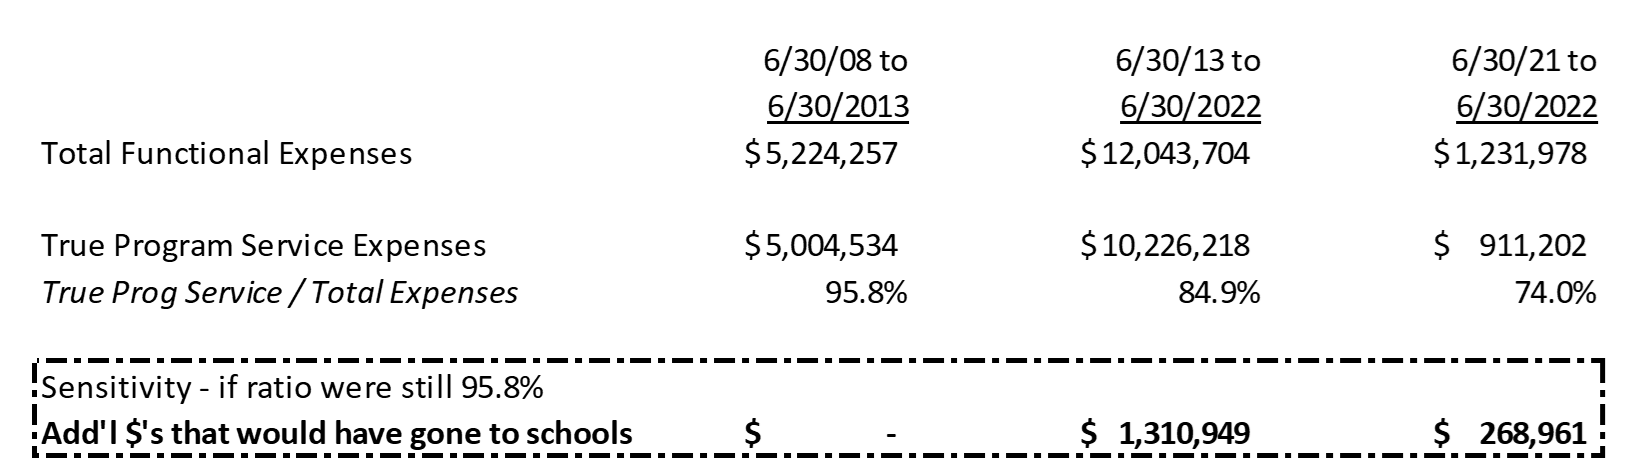
How did this happen? Spark revenue CAGR has remained constant from before Ryba (FYE’09 – ’13) and after (FYE’13 – ’22) at 3.9%, while management and general expenses have skyrocketed to 34.4% (per annum) since she joined the organization.
I also benchmarked Spark against 22 peer nonprofits where filing information was available in machine readable format going back 6 years from today to better understand if these trends were idiosyncratic to Spark or reflective of more general trends at these organizations. The takeaway is simple: this is a Spark issue.
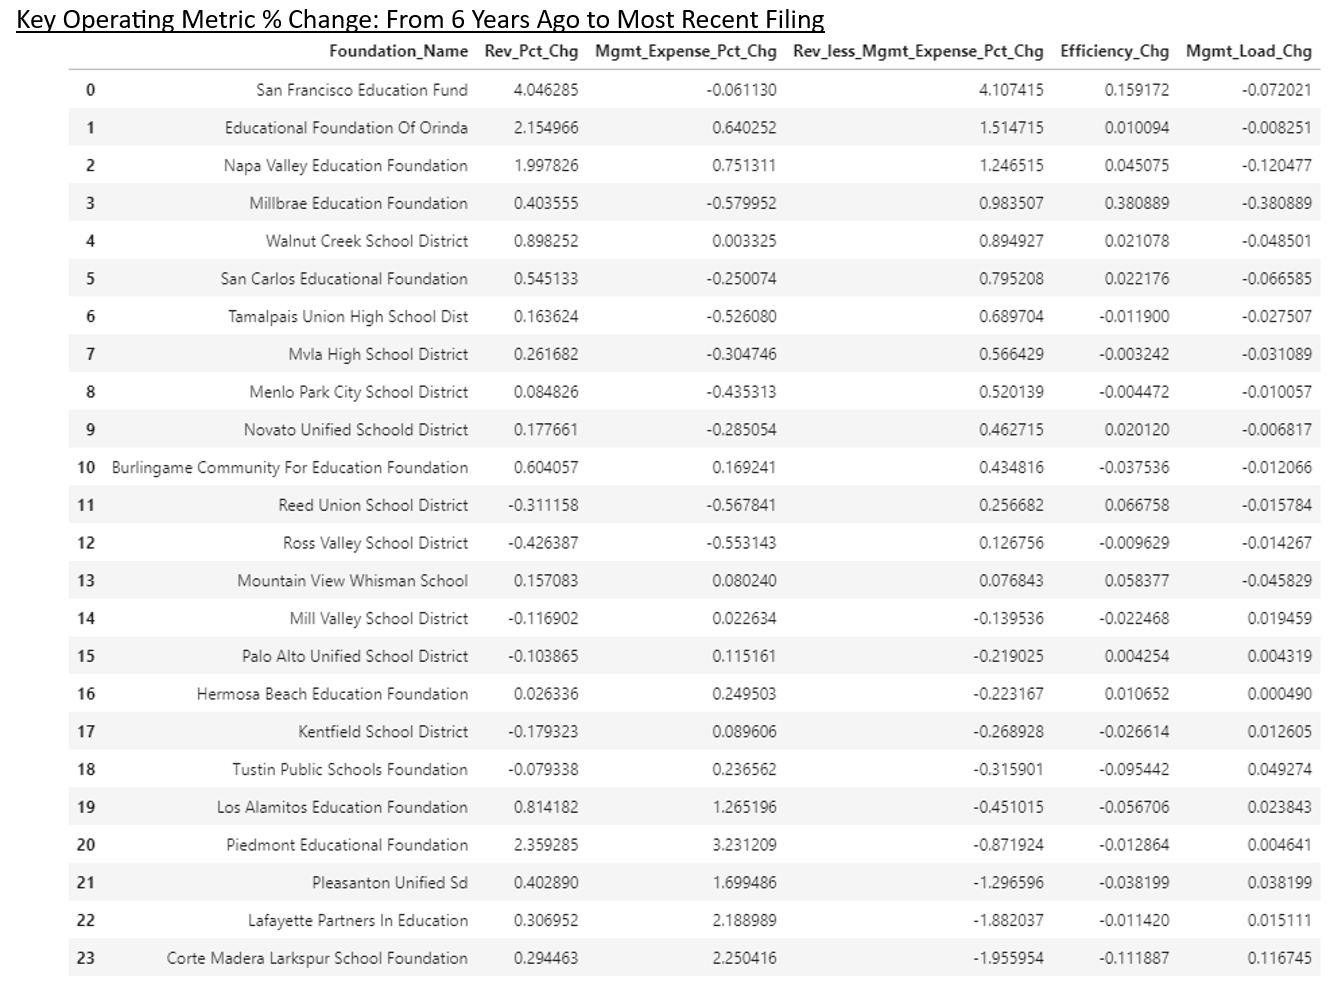
The below chart shows graphically the change for each nonprofit in Efficiency and Management Load over the last 7 years. Management Load is Management Expenses / Total Expenses (Including Grants).

While the magnitude of the leakage from funds that the community generously provided, leakage that represents funds that the school district has effectively missed out on, is already sizable looking backwards, the more concerning point is current Efficiency levels and the much greater impact prospectively. The 74% Efficiency level reported in 2022 is one of the very worst that we can find when benchmarking against 32 other comparable entities. Furthermore, the cost to the district with some simple assumptions can be forecast below and is both upsetting and alarming.
But so far Spark has termed Efficiency as we discuss it above as "irrelevant" (in an email from Director Jaime Heaps to me on Oct. 19th) and labeled the above math as allegations that “make no real world sense and have no basis in fact”. Yet, the figures basis are Spark's very own tax filings, and the relevance of nonprofit Efficiency is both intuitive and well-established (here called a Program % at Charity Watch). They have made no acknowledgements that the current cost structure is excessive nor any commitments to improving Efficiency going forward. Getting more of the donations to the kids will require the community speaking up. Sign the petition today and let them know you care.
The Spark Argument (as I understand it): I have been told that one of the points that Spark makes when asked about its 74% Efficiency in its latest fiscal year is that the math is flawed because Spark's tax filings do not include its Q4 gift to the district (given they didn't make the $307k payment until later, after the end of their fiscal year which ends in June).
I think this is a very fair point. The goal of all this is not to split hairs on accounting rules for revenue and cost recognition but to simply figure out how much money is going to the kids out of each dollar donated. I will show the math below if we were to include that $307k gift, and then also explain why I did not choose to make this adjustment in my math.
First, how to adjust the math:
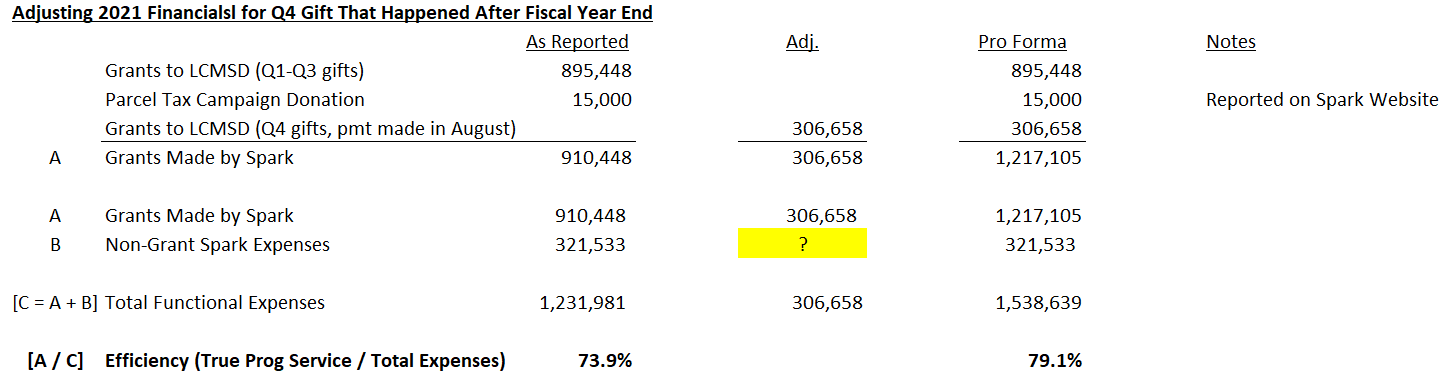
This adjustment serves to improve Spark's reported 2021 Efficiency from 74% to 79% if there are no expenses that were also incurred but not paid for in the period. It is an improvement, but not enough to change any of the points I make in substance above.
So why didn't I make that adjustment in my analysis? In Mr. Marotto's and my meeting with Dr. Geithman and Trustee Eric Schmautz, Trustee Schmautz talked about how the recognition of both grants and other costs (he used the annual Spark party that takes place at the end of the school year as an example) can be reported with a delay given Spark filings are on a cash-basis (so both grants and other expenses are recognized when paid, not when incurred). Since I don't have any visibility into what other expenses may also have been incurred in 2021 but paid for after the end of the fiscal year (and I wasn't adjusting any of the other district nonprofits' figures for timing in the above), I believe simply using the figures as presented in the tax filing is the "least bad" approach.
That said, we could try to present an Efficiency figure adjusted both for late cash grants and expenses with an audit. Sign the petition today and ask for Spark to agree to a free audit.
At the Spark Coffee Chat on September 15th, there was some protest regarding the validity of my math that mirrored Director Jaime Heaps' comments in the IJ article calling the math allegations that “make no real world sense and have no basis in fact”. In response I can only again point out that the math is a simple commonly-used ratio to analyze nonprofits where the numbers come directly from Spark's own tax filings.
Dr. Geithman made a different argument however on why the analysis should be largely discarded, first to Mr. Marotto and myself in our June 12th meeting alongside Trustee Eric Schmautz and then again at the Coffee Chat. I will present his argument here to the best of my ability (and commit to modifying the below if he suggests edits) and then respond.
Dr. Geithman makes two points:
Comparing Spark's Current Efficiency to Peer Nonprofit Efficiency Levels Isn't Useful Since Some Other Districts Provide Services to their Nonprofits (which reduces the nonprofit's operating expenses):
In the above analysis I have reviewed Spark's historical financial trends alongside 32 other peer school district nonprofits. It seems reasonable that if certain nonprofits are being subsidized it would result in different Efficiency ratios. I would invite Dr. Geithman to identify which school district nonprofits he believes are receiving subsidies in excess of what Spark receives from LCMSD (if anything, perhaps subsidized office rent?) and suggest a dollar estimate of the subsidy value. We can then verify with the relevant entities and seek to calculate an Adjusted Efficiency ratio by making adjustments to their 990 financial figures where it makes sense.
While I await Dr. Geithman gathering this information and forwarding it along so that we can improve the above analysis, I do not believe in the interim his anecdotal comments are enough to nullify the takeaways from the analysis above, as he seeks to do. The analysis above is surely imperfect but also reasonably robust, as it encompasses 33 school district nonprofits over a number of years.
Comparing Spark's Current Efficiency to Spark's Historical Efficiency Doesn't Make Sense Since it Used to Be a Volunteer-led Organization:
The argument extends that i) the shift from being volunteer-led to having a paid Executive Director and several other paid employees was both necessary because the increase in cost of living in Corte Madera and Larkspur has necessitated that most households are dual-income (implying fewer people have the ability to volunteer today so Spark must pay people to fill roles); and ii) Spark (and by extension the district and community) enjoys benefits from having paid employees that don't show up in this ratio because those people are higher performing and more accountable than a volunteer-led organization would be.
As it relates to the first point, I would counter that Spark remains heavily reliant upon volunteers, as do the PTO organizations in the district which consist entirely of volunteers. The idea that the volunteer base has left our community isn't accurate. And I don't think Spark must either have no employees or its current employee base that costs ~$232k per year. Rather, it seems the answer likely lies in the middle. We certainly can (and should) have paid employees to the extent we can afford them, and also seek to leverage volunteers in as many roles as possible because every dollar saved is a dollar more to the kids. Finally, the increase in cost of living is not unique to our community but also present across the peer district nonprofits being compared to Spark (all also in California) as well. But Spark's change in Efficiency has been much worse than peers over the last 7 years, despite all having had to navigate the more challenging volunteer dynamics that stem from higher cost of living. Additionally, looking at the change in Efficiency ratio allows us to normalize for different district nonprofits receiving potentially different levels of assistance from their beneficiary district and still observe noteworthy improvement or degradation trends at the various nonprofits.
Your voice matters. Despite my efforts, Spark and Dr. Geithman have yet to prioritize improved transparency and Efficiency. This current status quo isn't acceptable. Enhanced Efficiency means more resources for our children. Greater transparency ensures that donors can confidently contribute, knowing their hard-earned donations will be used wisely. By investing in a stronger Spark, we directly support our kids. Give your voice; our collective strength is the only way we will drive change. Sign the petition today and let Spark leadership know you care.